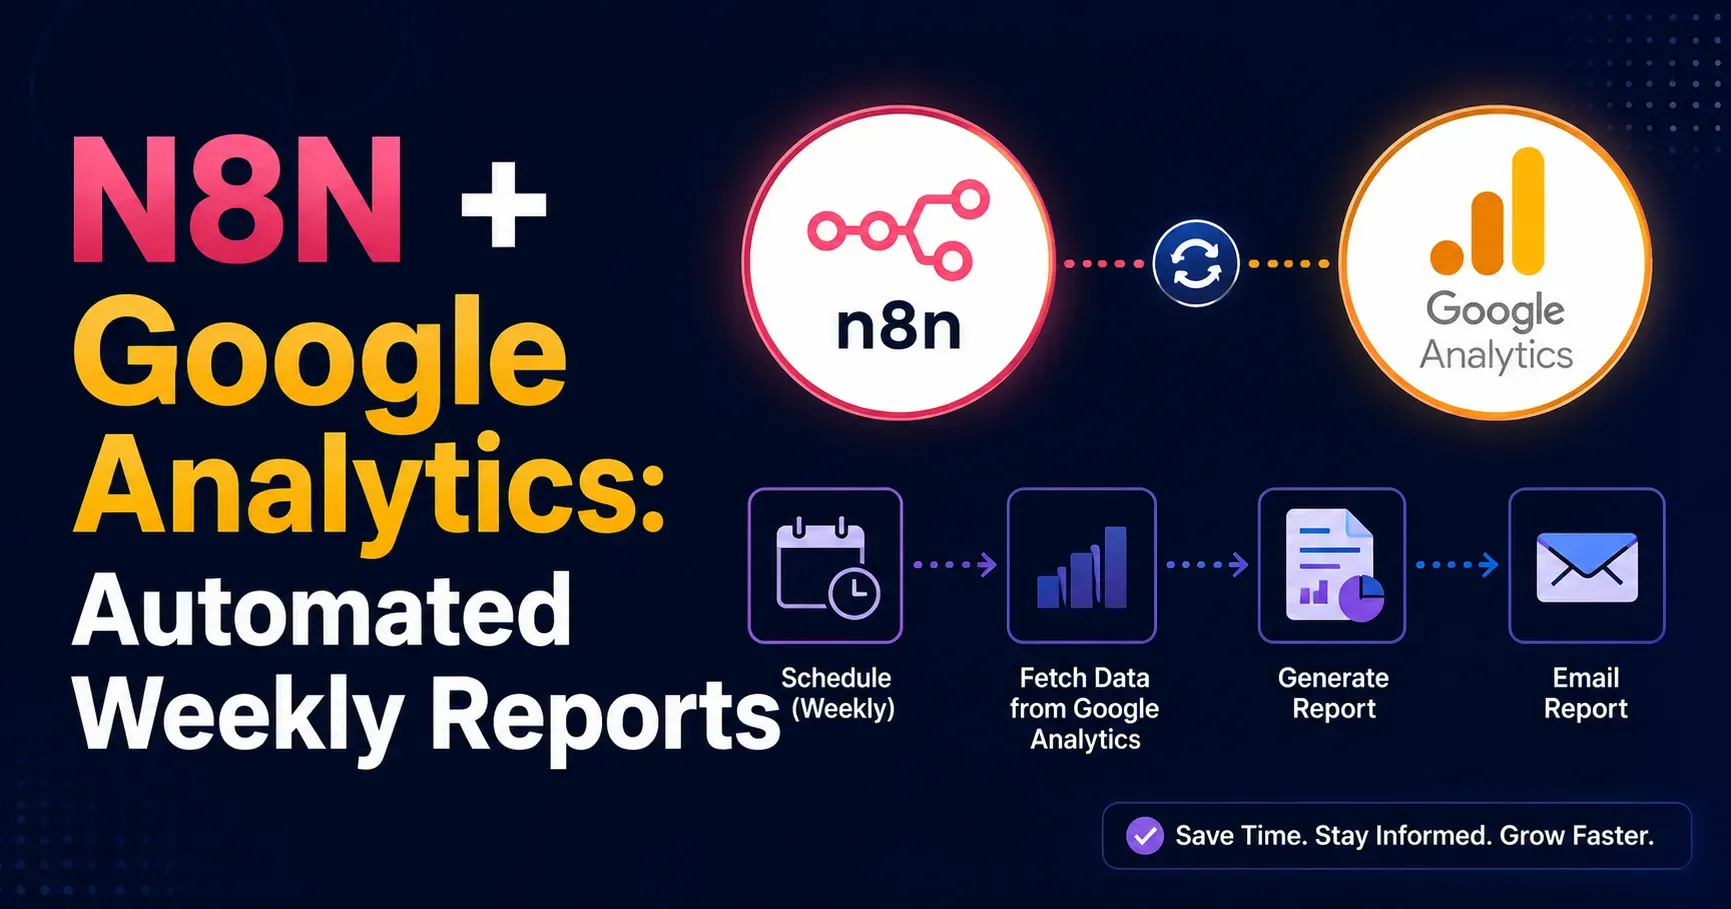
N8N Google Analytics Automated Weekly Reports
Pulling website performance data every week, formatting it into a readable report and distributing it to stakeholders is one of the most common yet time consuming tasks marketing and analytics teams face. Combining N8N, a flexible workflow automation platform, with Google Analytics allows teams to fully automate this process, pulling fresh data on a schedule, formatting it consistently and delivering it automatically without anyone needing to log in and manually export numbers each week. This guide explains how to use N8N and Google Analytics together to build automated weekly reports in 2026, covering setup, practical workflow examples and best practices for building a reliable, low maintenance reporting system.
Why Automate Weekly Analytics Reporting
Manually pulling Google Analytics data every week is repetitive, time consuming and prone to small inconsistencies, whether that is a missed metric, a formatting difference between weeks, or simply a delayed report because someone was busy or on leave. Automating this process ensures reports go out consistently, on schedule, with identical formatting every time, freeing up analyst and marketer time for actually interpreting the data and making decisions rather than repeatedly performing the same manual export and formatting steps.
Automated reporting also creates a more reliable historical record, since consistent structure over time makes it much easier to spot genuine trends rather than being confused by formatting differences between manually created reports produced by different team members.
How N8N and Google Analytics Work Together
N8N connects to Google Analytics through its API, allowing workflows to programmatically request specific metrics and dimensions on a defined schedule, rather than requiring a person to manually log into the Analytics interface each time. Once retrieved, this data can be processed, formatted and sent anywhere N8N can connect, including email, spreadsheets, team chat tools, dashboards or a centralized data warehouse.
This flexibility means the same underlying data pull can power multiple different report formats and destinations simultaneously, without needing to manually export and reformat the same data multiple times for different audiences or purposes.
Setting Up the N8N and Google Analytics Connection
Set Up Your N8N Instance
Choose between a cloud hosted or self hosted N8N setup based on your technical resources and data control preferences, then ensure your instance is running and accessible before beginning the Google Analytics integration process.
Create Google Cloud Credentials
Set up a project within Google Cloud Console and generate the appropriate API credentials needed to access the Google Analytics API, following Google's specific authentication requirements for programmatic API access.
Grant Analytics Access to the Credential
Ensure the credential or service account you created has appropriate view access to the specific Google Analytics property you want to pull reporting data from, since insufficient permissions are a common early setup issue that causes confusion.
Add the Credential Within N8N
Configure the Google Analytics credential within your N8N instance, establishing the secure connection that will allow your workflows to request data directly from your Analytics property going forward without repeated authentication steps.
Test With a Simple Data Pull
Before building a full reporting workflow, test the connection with a simple request, such as pulling basic session data for a recent date range, confirming the integration works correctly before adding formatting and distribution logic.
Building a Basic Automated Weekly Report Workflow
Set the Schedule Trigger
Configure a schedule trigger to run your workflow automatically at a consistent time each week, such as early Monday morning, ensuring reports are ready before the work week begins for your entire team.
Define the Date Range Dynamically
Set up your workflow to automatically calculate the previous week's date range dynamically, rather than hardcoding specific dates, ensuring the workflow continues functioning correctly indefinitely without manual date updates each week going forward.
Pull the Relevant Metrics
Configure your Google Analytics node to request the specific metrics and dimensions relevant to your reporting needs, such as sessions, users, conversion rate, top traffic sources or top performing pages for the defined date range.
Format the Data for Readability
Process the raw data returned from Google Analytics into a clean, readable format, whether that means calculating week over week percentage changes, rounding numbers appropriately, or organizing metrics into logical categories for the final report.
Send the Report to Its Destination
Configure the final step to deliver your formatted report to its intended destination, whether that is an email to stakeholders, a message posted to a team chat channel, or an update pushed to a shared spreadsheet or dashboard.
Practical Report Formats and Destinations
Email Summary Reports
Build workflows that compile key metrics into a clean, formatted email sent automatically to relevant stakeholders each week, providing a quick, digestible summary without requiring recipients to log into Analytics themselves at all.
Team Chat Notifications
Send condensed weekly performance summaries directly into a team chat channel, keeping performance visibility front of mind for the broader team without requiring a separate email check or dashboard login each week.
Spreadsheet Based Historical Tracking
Automatically append each week's data to a running spreadsheet, building a clean, consistent historical record over time that makes trend analysis and longer term reporting significantly easier than piecing together separate weekly exports manually.
Dashboard Data Feeds
Push automated data pulls into a business intelligence or dashboard tool, keeping visual reporting dashboards continuously updated without manual data refresh steps required from anyone on the team each week.
Enhancing Your Automated Reports With Additional Context
Adding Week Over Week Comparisons
Configure your workflow to calculate and display percentage changes compared to the previous week, giving report recipients immediate context about whether performance is trending up or down without needing to manually compare numbers themselves.
Highlighting Significant Changes Automatically
Build conditional logic that flags metrics with unusually large changes, whether positive or negative, helping draw immediate attention to genuinely noteworthy shifts rather than requiring someone to scan every number manually each week for anomalies.
Combining Data From Multiple Sources
Enrich your Google Analytics data by combining it with information from other connected tools within the same workflow, such as advertising spend data or sales figures, providing a more complete performance picture in a single unified report each time.
Including Visual Charts
Where your chosen destination supports it, incorporate simple charts or visual elements into your automated reports, since visual representation often communicates trends more quickly and clearly than raw numbers alone to a busy reader.
Best Practices for Reliable Automated Reporting
Start With the Metrics That Matter Most
Rather than pulling every available metric, focus your initial automated report on the specific numbers that genuinely drive decisions for your team, expanding gradually only as clear additional needs emerge over time through actual use.
Build in Error Notifications
Configure your workflow to send an alert if the data pull or report generation fails for any reason, ensuring issues are caught and resolved quickly rather than resulting in a missed or incomplete report going unnoticed by the team.
Test Across Multiple Weeks Before Full Reliance
Run your automated report alongside manual verification for the first several weeks after launch, confirming accuracy and catching any edge cases before fully relying on the automation without oversight from a team member.
Document the Workflow Logic Clearly
Maintain clear documentation of exactly what metrics are being pulled, how they are calculated or formatted, and where the report is sent, ensuring the system remains understandable and maintainable as team members change over time.
Common Challenges When Automating Analytics Reports
API quota limits can occasionally affect very high frequency or high volume reporting workflows, so understanding Google Analytics API usage limits and designing your workflow accordingly helps avoid unexpected failures during peak reporting periods.
Data sampling within Google Analytics for very high traffic properties can occasionally affect the precision of certain metrics, which is worth understanding when interpreting automated report results for large scale websites with significant traffic volume. Changes to Google Analytics properties, such as new tracking configurations or renamed dimensions, can occasionally break existing workflows, making periodic review and testing an important ongoing maintenance practice rather than a one time setup task.
Expanding Beyond Basic Weekly Reports
Once a basic automated weekly report is running reliably, consider expanding into more sophisticated reporting scenarios, such as monthly executive summaries with higher level strategic metrics, automated alerts for significant traffic anomalies detected outside normal patterns, or segmented reports tailored to different stakeholders with different specific interests, such as a content team focused on page level engagement versus a paid media team focused on conversion tracking and campaign specific performance data.
A Simple Getting Started Checklist
Set up your N8N instance and establish a secure, properly permissioned connection to your Google Analytics property. Identify the specific metrics that matter most for your team's weekly decision making before building anything.
Build a basic workflow with a weekly schedule trigger, a dynamic date range calculation, a data pull step and a simple formatted output sent to your chosen destination. Test the workflow across several weeks alongside manual verification before fully relying on it. Once confirmed reliable, gradually enhance the report with comparisons, highlights or additional data sources based on genuine team needs identified over time.
Final Thoughts
Combining N8N and Google Analytics to automate weekly reporting eliminates one of the most repetitive, time consuming tasks many marketing and analytics teams face, while also improving consistency and reliability compared to manual reporting processes. By starting with a focused set of key metrics, testing thoroughly before full reliance, and gradually expanding based on genuine team needs, businesses can build a sustainable, low maintenance automated reporting system that frees up valuable time for actually interpreting data and making informed decisions throughout 2026 and beyond.