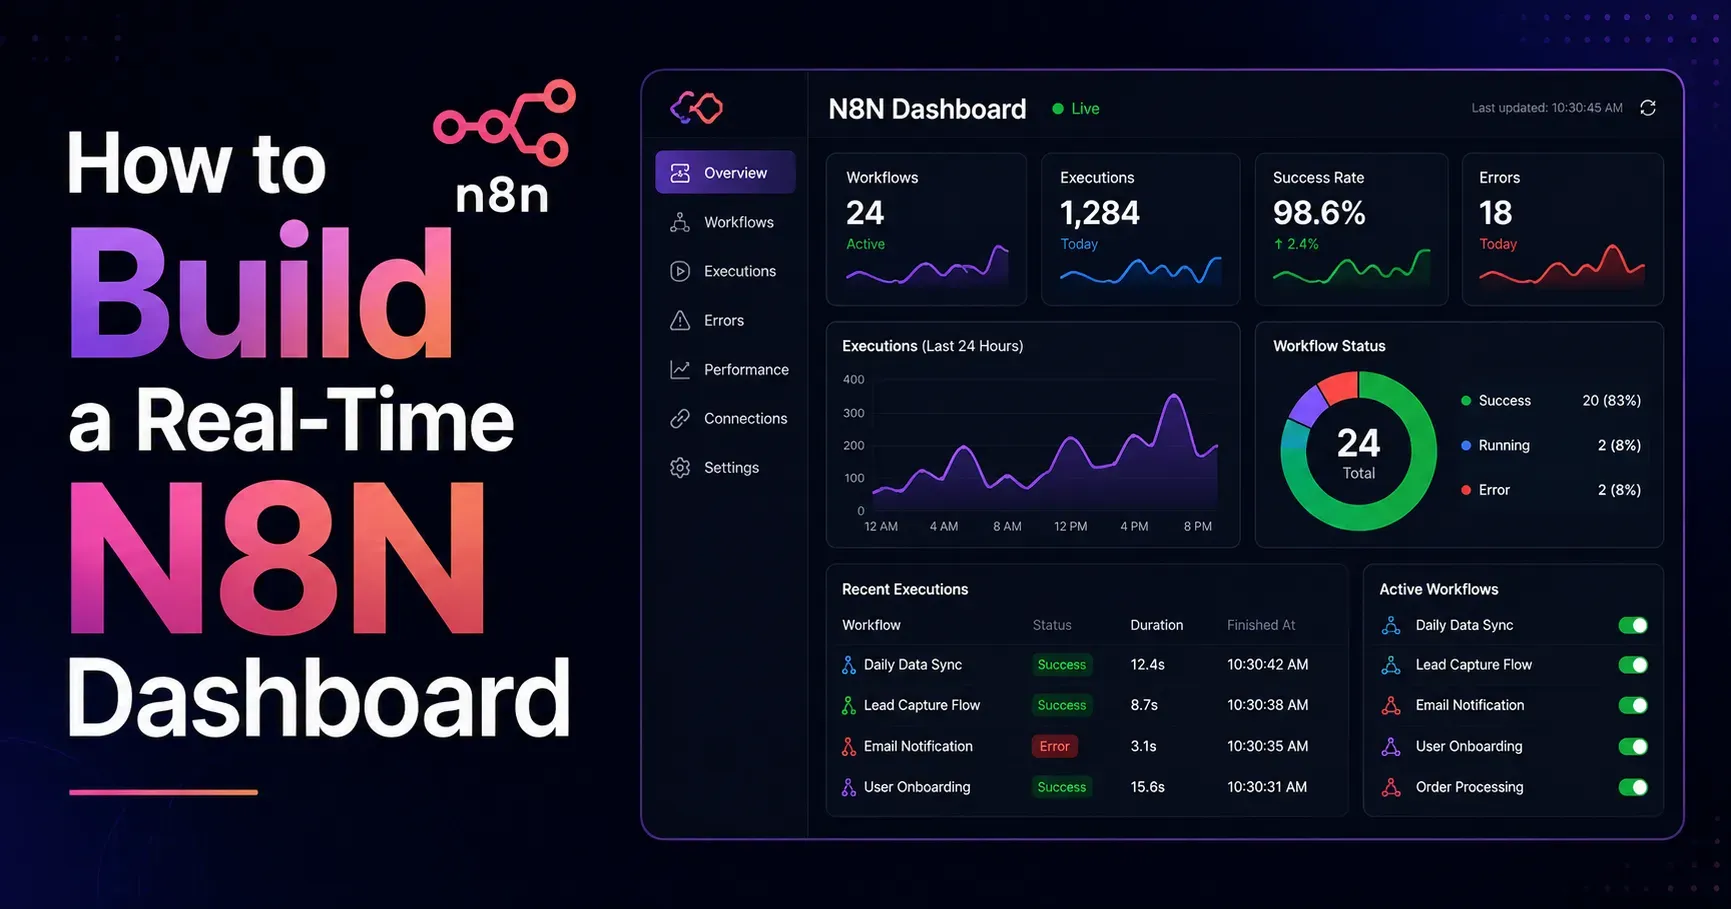
How to Build a Real Time N8N Dashboard
Static reports that only get updated once a week or once a month leave teams working with outdated information for far too long, especially when metrics like website traffic, support ticket volume or sales activity can shift meaningfully within hours. A real time dashboard built with N8N solves this by continuously pulling fresh data from multiple sources and keeping a visual display genuinely current, without requiring anyone to manually refresh or re export data throughout the day. This guide walks through how to build a real time N8N dashboard in 2026, covering architecture decisions, data source connections, update frequency planning and practical tips for keeping the system reliable over time.
What a Real Time N8N Dashboard Actually Means
A real time dashboard, in the context of N8N automation, does not necessarily mean data updates every single second, but rather that data refreshes frequently and automatically enough that the dashboard reflects genuinely current conditions rather than stale, outdated numbers. N8N itself is not a dashboard visualization tool, it is a workflow automation platform that connects to data sources, processes information and pushes it into a separate dashboard or visualization tool where the actual display happens.
Understanding this distinction is important, since building a real time dashboard with N8N involves combining N8N's automation capabilities with a dedicated visualization platform capable of displaying the data attractively and interactively for the people who need to see it.
Choosing a Visualization Platform to Pair With N8N
Spreadsheet Based Dashboards
Connected spreadsheets offer a simple, familiar visualization option, particularly for smaller teams or simpler reporting needs, with N8N automatically updating cells or charts on a regular schedule throughout the day.
Dedicated Business Intelligence Tools
Purpose built dashboard and business intelligence platforms offer more sophisticated visualization options, interactivity and design flexibility, making them well suited for more complex, multi source dashboards intended for wider organizational visibility across teams.
Custom Web Based Dashboards
For teams with development resources, a custom built web dashboard offers maximum flexibility in design and functionality, with N8N pushing data into a database or API that powers the custom interface built for that specific need.
Team Communication Platform Widgets
Some teams prefer surfacing key real time metrics directly within a team chat platform through automated messages or pinned updates, prioritizing visibility within existing daily workflows over a separate, dedicated dashboard interface entirely.
Planning Your Dashboard Before Building
Define What Genuinely Needs to Be Real Time
Not every metric requires constant updating. Identify which specific data points genuinely benefit from frequent, near real time updates, such as active support tickets or live sales activity, versus metrics that are perfectly fine updating daily or weekly instead.
Identify All Required Data Sources
List every system your dashboard needs to pull data from, whether that is a customer relationship management tool, an analytics platform, a support ticketing system or an e commerce platform, since this shapes your overall N8N workflow architecture significantly from the start.
Determine the Appropriate Update Frequency
Balance genuine business need for freshness against practical considerations such as API rate limits and system load, choosing an update frequency, whether that is every few minutes or every hour, that provides meaningful currency without unnecessary strain on connected systems.
Sketch the Dashboard Layout
Before building any automation, sketch out roughly what the final dashboard should display and how information should be organized, ensuring your data collection and processing workflow in N8N is built specifically to support that intended final layout.
Building the Data Collection Workflows
Set Up Trigger Types for Each Data Source
Depending on the specific data source and how real time your dashboard genuinely needs to be, use either scheduled polling triggers that check for new data at regular intervals, or webhook triggers that receive data immediately whenever an event occurs in a connected system.
Connect Each Data Source Individually
Build separate workflow branches or entirely separate workflows for each data source, keeping the logic for retrieving and processing data from each system clean and independently maintainable rather than combining everything into one overly complex workflow that becomes hard to troubleshoot.
Standardize Data Formats Across Sources
Since different systems often return data in different formats and structures, build transformation steps within your workflows that standardize incoming data into a consistent format before it reaches your dashboard destination.
Handle Errors Gracefully
Configure error handling for each data connection, ensuring that a temporary issue with one specific data source does not cause your entire dashboard update process to fail, but instead continues updating with the data that is successfully available at that time.
Pushing Data to Your Dashboard Destination
Configure the Output Connection
Set up the appropriate N8N node or custom API call to push your processed data into your chosen visualization platform, whether that is updating specific spreadsheet cells, sending data to a business intelligence tool's API, or writing to a database powering a custom dashboard.
Structure Data for Easy Visualization
Format your outgoing data specifically to match what your visualization platform expects, since properly structured data significantly simplifies the chart and display configuration process on the visualization side later on.
Test the Full Pipeline End to End
Before relying on the dashboard for real decision making, test the complete pipeline from initial data source through to final visual display, confirming data flows correctly and updates appear as expected throughout the entire chain of steps.
Practical Real Time Dashboard Examples
Customer Support Activity Dashboard
Pull live ticket volume, response time and resolution rate data from a support platform, displaying current team workload and performance trends throughout the day to help managers allocate resources effectively in real time as needs shift.
Sales and Revenue Tracking Dashboard
Combine data from a customer relationship management system and payment processor to display live sales activity, revenue tracking against targets, and pipeline movement throughout the day for sales leadership visibility and quick decisions.
Website and Marketing Performance Dashboard
Aggregate data from analytics platforms, advertising accounts and email marketing tools into a single dashboard showing current traffic, campaign performance and conversion metrics without needing to check multiple separate platforms individually each day.
Operations and System Health Dashboard
Monitor system uptime, error rates or operational metrics from internal tools, providing an at a glance view of system health that helps technical teams identify and respond to issues quickly as they arise during the day.
Optimizing Dashboard Performance and Reliability
Balance Update Frequency With System Load
Avoid setting update intervals more frequent than genuinely necessary, since excessive polling can strain connected systems, hit API rate limits, or create unnecessary costs depending on how your data sources are priced and structured overall.
Cache Data Where Appropriate
For data that does not need to be pulled fresh on every single update cycle, consider caching strategies within your workflow to reduce unnecessary repeated API calls while still maintaining reasonably current information overall for viewers.
Monitor Workflow Execution Health
Set up monitoring or notifications for your underlying N8N workflows themselves, ensuring you are alerted promptly if a workflow powering your dashboard fails or begins running significantly slower than expected under load.
Plan for Data Source Downtime
Build workflows that handle temporary unavailability of a connected data source gracefully, such as displaying the most recent successfully retrieved data rather than showing an error or blank section on the dashboard itself to viewers.
Common Mistakes When Building Real Time Dashboards
Many teams attempt to make every single metric update in true real time immediately, when a more moderate, thoughtful update frequency would provide nearly identical practical value with significantly less system complexity and cost involved. Avoid building an overly complex initial dashboard covering too many data sources and metrics at once, since starting focused and expanding gradually tends to produce a more reliable, genuinely useful final result overall.
Do not neglect error handling and monitoring for the underlying workflows, since a dashboard silently displaying outdated or broken data without any indication can be more harmful than no dashboard at all if decisions are made based on inaccurate information. Finally, avoid skipping the planning and sketching phase, since a poorly planned dashboard layout often requires significant rework once the actual data starts flowing in from live sources.
Maintaining Your Dashboard Over Time
Regularly review your dashboard's actual usage and relevance, removing or updating metrics that are no longer genuinely useful to the team members relying on it for decisions each day. Periodically audit your underlying N8N workflows for efficiency, ensuring update frequencies and data processing logic still make sense as your business needs and data volume evolve over time.
Stay attentive to changes in your connected data sources, such as API updates or changed field names, which can occasionally break existing workflows and require prompt updates to keep the dashboard functioning correctly and reliably for everyone depending on it.
A Simple Framework for Getting Started
Begin by clearly identifying which specific metrics genuinely benefit from real time or near real time visibility, rather than attempting to make everything update instantly from the very start. Choose a visualization platform that matches your team's technical resources and design needs realistically.
Build and test data collection workflows for each source individually before combining them into a complete dashboard pipeline. Configure appropriate error handling and monitoring throughout the entire system. Launch with a focused set of core metrics, then expand gradually based on genuine, demonstrated team needs rather than speculative future requirements that may never materialize.
Final Thoughts
Building a real time N8N dashboard gives teams continuous visibility into the metrics that matter most, replacing outdated, manually updated reports with a genuinely current, automated view of business performance. By thoughtfully planning which metrics truly need real time updates, choosing an appropriate visualization platform, and building reliable, well monitored data collection workflows, teams can create a dashboard that becomes a genuinely trusted, ongoing part of daily decision making throughout 2026 and beyond, rather than another tool that quickly falls out of use.